Kim30
Member
Thank you. I feel stupid for not double checking.
Follow along with the video below to see how to install our site as a web app on your home screen.
Note: This feature may not be available in some browsers.
Never feel stupid for asking questions.Thank you. I feel stupid for not double checking.
Yeah that’s what I’m seeing but the models seem to be all over the map with precip type at crucial times of the show. Are there some warm nose mixing issues?I am beginning to wonder if they should extend the WWA southward a bit. The dry slot looks to be setting up further to the east, precip rates are quite high tomorrow midday and fairly widespread as temps drop over Central Alabama.
The 850 mb cold air is actually coming in from the south and west....and is both sped up and slowed down by all kind of mesoscale processes, very complicated setupYeah that’s what I’m seeing but the models seem to be all over the map with precip type at crucial times of the show. Are there some warm nose mixing issues?
Ok, makes sense that it doesn’t make sense right now. I can say that this system is one of the most complex ones I can recall in a bit in terms of uncertainty with so many factors throughout the atmosphere and definitely some of the wildest maps I have seen on model runs were we to take them at face value.The 850 mb cold air is actually coming in from the south and west....and is both sped up and slowed down by all kind of mesoscale processes, very complicated setup
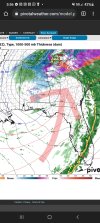
850mb temps...Ok, makes sense that it doesn’t make sense right now. I can say that this system is one of the most complex ones I can recall in a bit in terms of uncertainty with so many factors throughout the atmosphere and definitely some of the wildest maps I have seen on model runs were we to take them at face value.
Thanks for the map. Interesting look at those 850s. I do see the cold comma look with those. Very interesting!850mb temps...
Notice not all the cold air moves in, it actually just gets colder on its own due to the dynamics.Thanks for the map. Interesting look at those 850s. I do see the cold comma look with those. Very interesting!


Boy that would sure get the meteorological community talking!This is what the GFS has as total forecast snowfall thru end of January should the forecast hold up. This map shows a Baton Rouge with 17" & Biloxi with 15"!
View attachment 11878
Isn't that CAL from the old forum?From Meteorologist Chris Lisauckis in Huntsville Good Evening, after reviewing the latest computer model data and applying various meteorological techniques, I see no reason to change the forecast much from earlier. The Tennessee Valley Region of northern Alabama and southern middle Tennessee will be located in an ideal location for very heavy snow between 9am and 3pm Sunday. Whiteout conditions are likely at times over the area and travel problems will likely develop throughout the morning hours. An experimental snow forecasting index I am developing indicates 2-3" per hour snowfall rates are possible, and thundersnow. A fair amount of this snow will likely melt because of above freezing surface temperatures, however I still expect 5-7" across a large part of the area. Unfortunately, due to the difficulty of this forecast, it's not possible to predict locations where these totals are most likely at this time. The Tennessee Valley will be located in the left exit region of the high altitude jet stream portion of the storm system, which may allow temperatures to dynamically cool more than expected at the surface as heavy precipitation continues. Only a few degrees of surface temperature will separate us from getting 5-7" and 8-10" of snow. Things could change with the forecast. Please expect the unexpected.
Hey there, I am pretty sure it is. We’ve seen quite a few success stories since back in the day in the Met realm!Isn't that CAL from the old forum?