- Thread starter
- #21
KevinH
Member
Reed went live and started using the “O” word for Thursday. Not a guarantee but just adds to how much attention this week warrants, especially for MS/AL/TN.
Follow along with the video below to see how to install our site as a web app on your home screen.
Note: This feature may not be available in some browsers.
Reed went live and started using the “O” word for Thursday. Not a guarantee but just adds to how much attention this week warrants, especially for MS/AL/TN.
Yeah, still a few days away, BUT I wanted to post it just in case other people would want to watch.Eh, it's Reed.
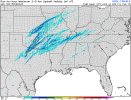
Unstable warm sector looks pretty narrow overnight Wednesday and through the day Thursday on GFS/NAM with not great lapse rates, despite some favorable-looking hodographs. I'd be hesitant to call this an outbreak at this time, but certainly the potential exists for a rogue spinner or two not unlike 2/3.
Subject to change, as always but…..
Yes it is…. Damn that Gulf of MexicoI hate the timing of this - middle of the night. Hopefully, it changes to daylight hours or fails to verify. 3am is just a terrible time for svr/tor weather.
Yes it is…. Damn that Gulf of Mexico
")
I understand.Clarification - 3am is a terrible time from a human awareness/alertness standpoint.
It’s 3 a.m and I’m feeling lonely!!! had to do the song referenceI understand.
I said damn the Gulf of Mexico bc it can be a source of overnight “fuel” for storms. I am not sure how much that will be the case this week (if at all), but the GOF is the first thing that comes to mind when I hear about overnight tornadoes.
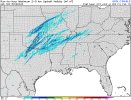
Woah, hold on, that's showing the model run maximum, that's not showing what's going on at 3am CST, it's showing what has happened over the previous 105 hours UNTIL 3am CST 2/17/22.
Subject to change, as always but…..

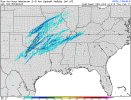
It looks like we might have some 'nader juice' available during the afternoon Thursday in MS and western TN.
Woah, hold on, that's showing the model run maximum, that's not showing what's going on at 3am CST, it's showing what has happened over the previous 105 hours UNTIL 3am CST 2/17/22.
Thanks for the clarification. I am trying to understand how any data going back 105 hours would be helpful with general close range forecasting (~ 12 hours or less)? Meaning: I can't see how data for updrafts 90 hours ago in Texas has any significant bearing on forecasted updrafts in Alabama 90 hours later? I'm just trying to wrap my head around it.
So - the terminology "run-to-hour Maximum" is how to identify a summary (ie, maximum) of model data for a certain range of time?
I did a google search for "weather model 'run to hour maximum'" and did not find anything that helped explain.
I think it’s easier to use if you watch the full forecast model run, rather than just looking at the end of the forecast.Thanks for the clarification. I am trying to understand how any data going back 105 hours would be helpful with general close range forecasting (~ 12 hours or less)? Meaning: I can't see how data for updrafts 90 hours ago in Texas has any significant bearing on forecasted updrafts in Alabama 90 hours later? I'm just trying to wrap my head around it.
So - the terminology "run-to-hour Maximum" is how to identify a summary (ie, maximum) of model data for a certain range of time?
I did a google search for "weather model 'run to hour maximum'" and did not find anything that helped explain.
This one?I can't post it at the moment but the latest Day 2 has expanded east to include all of North Alabama and most of Tennessee from about Crossville west.