• Welcome to TalkWeather!
    We see you lurking around TalkWeather! Take the extra step and join us today to view attachments, see less ads and maybe even join the discussion.
    CLICK TO JOIN TALKWEATHER

Significant Tornado Events

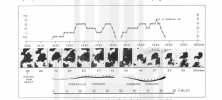
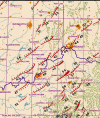
Fujita’s reflectivity mosaic for the super outbreak at 0Z. Not high definition or exact by any means, but gives a good look at the aerial extent of the event. I’m sure the “squall line” was more filled in but you can even see some supercells in it. You can easily make out Convective Band 1 supercells in Georgia and the Tennessee/North Carolina border. The showers farther to the east were remnants of a stalled front from a previous system. The Laurel MS F3 supercell is also visible all by itself in southeastern Mississippi. Of course, the other supercells visible don’t need introductions.


I’ve found some really cool radar images and other tidbits from this event, do you all think they should go in this thread or should I just put all my findings in one individual thread?

1759158044463.png
 
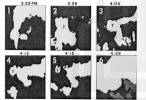
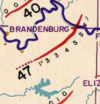
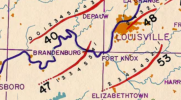
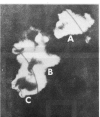
Radar reflectivity of the Brandenburg tornado. Interestingly enough, it seems to have been occluding when it hit Brandenburg. The “T” is the approximate location of the actual tornado. This also seems to be backed up on Fujita’s track map, with the tornado track showing a slight jog to the north near Brandenburg before a more dramatic jog north.

The town was hit at approximately 4:08-4:11 CDT.

At 4:12 and 4:15 you can see small shower activity around the hook which seems to have merged with the storm by 4:29. This activity, merging and reorganization may have caused the decent gap in dormant tornado activity between the Brandenburg and Louisville tornados. Relative to the DePauw tornado family which cycled much more quickly (more on why that is later)

1759160445312.png

1759160554903.png
1759161742832.png
 
Last edited:
(Let me know if I’m swamping this thread with too much and I’ll throw this in its own thread)

The northern portion of the 4/3/74 super-outbreak (IN/OH/Northern KY) seemed to have a “string of pearl” storm mode starting out, similar to 3/14. Supercells that were obviously discrete, but still banded in some portions.

This is a shot from the Evansville radar looking directly into northern KY of supercells active in Northern KY.
1759178420801.png

Supercell A went on to produce the aforementioned Brandenburg/Louisville tornado family, which were tornados 47, 48, and 49 on Fujita’s map. Supercell B was positioned unfavorably for inflow due to Supercell C’s proximity. B never produced a tornado and dissapated. Supercell C was prolific and produced the Elizabethtown KY tornado family (tornados 52 through 56 per Fujita’s map). This family included 3 F4s and spawned the Frankfort KY F4 that tornadotalk has a wonderful article on. Supercell C would trek all across Kentucky and produce its final tornado on the KY/OH line. It’s pure conjecture but I hypothesize the developing echo return south of supercell C later produced the Danville KY tornados (58 & 59 on Fujita’s map). I’ll have to research that further.

Interestingly enough, the southern Indiana cells displayed a similar configuration, one hour earlier.

1759178703147.png

At this time Supercell A was producing tornado 35, and would later drop the Hamburg F4 (tornado 36).

Supercell B was positioned unfavorably relative to the other storms. Similar to the KY Supercell B it never produced a tornado.

Supercell C was producing the DePauw F5 at this time and was also extremely prolific in its own right. It was responsible for 6 tornados. 2 were F5s, 3 F4s, and one F2 (40-45 on the map). It seems Supercell C was a much more efficient cycler since it had a completely wide open inflow sector to its south with minimal interference from other storms.

Here is Fujita’s analysis of Supercell A showing its appearance throughout its lifetime as well as when it was producing tornados.

1759179405402.png

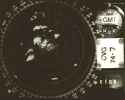
Finally, the infamous Cincinnati radar photo. By now storm mode was fully discrete. The Xenia cell can be seen to the northeast of the radar site. The monster cell closest northwest to the radar is the Hamburg F4. The well developed cell southwest of the site I believe is the DePauw cell which would later impact Cincinnati as the Sayler Park F5. Supercell B is possibly the strung out cell north of the Sayler Park supercell. I believe the furthest cell to the northwest is the Muncie Indiana F4 supercell (tornados 31-33).

1759179843427.png

1759179881065.png

I’ll definitely be covering the Central KY to Alabama portion too!
 
Last edited:
(Let me know if I’m swamping this thread with too much and I’ll throw this in its own thread)

The northern portion of the 4/3/74 super-outbreak (IN/OH/Northern KY) seemed to have a “string of pearl” storm mode starting out, similar to 3/14. Supercells that were obviously discrete, but still banded in some portions.

This is a shot from the Evansville radar looking directly into northern KY.
View attachment 46827

Supercell A went on to produce the aforementioned Brandenburg/Louisville tornado family, which were tornados 47, 48, and 49 on Fujita’s map. Supercell B was positioned unfavorably for inflow due to Supercell C’s proximity. B never produced a tornado and dissapated. Supercell C was prolific and produced the Elizabethtown KY tornado family (tornados 52 through 56 per Fujita’s map). This family included 3 F4s and spawned the Frankfort KY F4 that tornadotalk has a wonderful article on. Supercell C would trek all across Kentucky and produce its final tornado on the KY/OH line. It’s pure conjecture but I hypothesize the developing echo return south of supercell C later produced the Danville KY tornados (58 & 59 on Fujita’s map). I’ll have to research that further.

Interestingly enough, the southern Indiana cells displayed a similar configuration, one hour earlier.

View attachment 46828

At this time Supercell A was producing tornado 35, and would later drop the Hamburg F4 (tornado 36).

Supercell B was positioned unfavorably relative to the other storms. Similar to the KY Supercell B it never produced a tornado.

Supercell C was producing the DePauw F5 at this time and was also extremely prolific in its own right. It was responsible for 6 tornados. 2 were F5s, 3 F4s, and one F2 (40-45 on the map). It seems Supercell C was a much more efficient cycler since it had a completely wide open inflow sector to its south with minimal interference from other storms.

Here is Fujita’s analysis of Supercell A showing its appearance throughout its lifetime as well as when it was producing tornados.

View attachment 46829

Finally, the infamous Cincinnati radar photo. By now storm mode was fully discrete. The Xenia cell can be seen to the northeast of the radar site. The monster cell closest northwest to the radar is the Hamburg F4. The well developed cell southwest of the site I believe is the DePauw cell which would later impact Cincinnati as the Sayler Park F5. Supercell B is possibly the strung out cell north of the Sayler Park supercell. I believe the furthest cell to the northwest is the Muncie Indiana F4 supercell (tornados 31-33).

View attachment 46830

View attachment 46831

I’ll definitely be covering the Central KY to Alabama portion too!
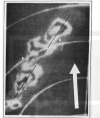
The range rings and arrow in the first picture are confusing me direction wise. If it's looking south, why do the range rings arc to the northwest? Obviously the supercells are oriented about how you would expect. Where did these images come from?
 
Last edited:
The range rings and arrow in the first picture are confusing me direction wise. If it's looking south, why do the range rings arc to the northwest? Obviously the supercells are oriented about how you would expect.
Most likely an oversight on my part by mixing up the radar sites that were sourced for the second photo featuring DePauw. Forbes’ paper doesn’t specify the actual radar site for the image but does specify data was collected from the Nashville and Cincinnati radars, which would make more sense as you indicated. Thanks for catching that, I’ll make sure I edit the post.

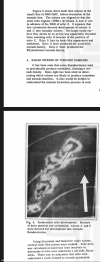
Here is the description in full. Forbes was using the arrow to demonstrate surface flow.

1759195157435.png

Sourced from Greg Forbes’ paper “Relationship Between Tornadoes and Hook Echos on April 3, 1974”
 
Last edited:
Where did these images come from?
Missed this portion of your post. I was able to find a lot of Fujita’s early work digitized on Texas Tech’s Southwest/Special Collections library.

Radar Mosaic and Brandenburg hook echo images were sourced from Fujita’s “New Evidence from April 3-4, 1974 Tornadoes”

DePauw & Indiana Supercell complex images were sourced from Fujita’s “Jumbo Tornado Outbreak of 3 April 1974”

The zoom in radar analysis of the Jonesville & Hamburg supercell was from Fujita & Forbes’ “Super-Outbreak Tornadoes of April 3, 1974 as seen in ATS pictures”

Then of course Forbes’ hook echo study for the KY supercell images.

The Cincinnati Radar image is from NWS Wilmington’s event page.
 
If you're not going to post any of the fundamental basis - like formulae and mechanisms - as to how he's coming to these conclusions, then I'm not going to give them much credence.
In his own words:

“ By plotting the couplet location across multiple radar scans and lower tilts, this showed the couplet would have had to have traveled at an average of 140 mph across that gap in 40 seconds to cover the ground it did according to radar. This leads to the conclusion that a secondary, newer circulation developed around a mile east of the rapidly dissipating Smithville circulation. “

I asked him about potential radar mispositioning/miscoorelation, and he responded:

“ This tornado occurred extremely close to the radar, scans were only a few hundred feet above radar level. Also, the potential errors with couplet locations was something I did think about when trying to prove the cycle. I plotted the center of the reflectivity/velocity couplets/debris balls and matched its location with ground observed damage centerlines. At all points the radar data correlated perfectly with observed ground damage. ”

The radar used was also in Amory, not Columbus, which had the storm only a few hundred feet up. As for the apparent “tornado-caused tree blowdown”, those trees are on a hill and trees can fall in ways not caused by tornadoes.
im a bit confused is this about the smithville tornado?

if so what so call gap are we talking about , the new wren gap or the alabama border gap.

anyhow for the alabama gap there were just a few trees down.
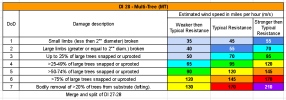
if we are going off the new multi tree di for the new ef scale , it would be 50 to 95 mph damage (DOD3)
1759266722437.png

as for the new wren , Smithville gap , there is indeed a gap , however the Smithville recycle happened much earlier then what NWS states.


HACKLEBURG
there are other april 27 2011 gaps to talk about , like hackleburg possibly being 2 to 3 tornadoes.

the main EF5 , then a large gap , a possible small EF0 a small gap then a EF3

Cullman seem to have been 2 to 3 tornadoes as well (one was a satellite however)

the non satellite second tornado from Cullman happened at the end.

TUSCALOOSA
Tuscaloosa also seem to have been 2 tornadoes however unlike the others there's no gap , the main Tuscaloosa EF4 touched down much earlier in its life , then a few moments later a second tornado seem to have form (scar can be seen a bit on google earth) and then merge with the EF4 , this all happened before entering Tuscaloosa tough.

there is a video what appears to be 2 large tornadoes when the EF4 was in the forested area between Tuscaloosa and Birmingham , but there are no tornado scars to show there were 2 at this point.
i wish to re find this video but its hard to find it.

CORDOVA
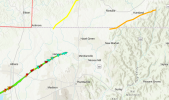
and that's nothing compared to the mess that is the Cordova tornado , there are points that almost seems to be 4+ gaps , sometimes 3 separate scars at the same spot , and even a video that shows 2 to 3 tornadoes on the ground the same time.
1759267311874.png

its harder to map out Cordova with the EF3 that happened that same morning.
 
In his own words:

“ By plotting the couplet location across multiple radar scans and lower tilts, this showed the couplet would have had to have traveled at an average of 140 mph across that gap in 40 seconds to cover the ground it did according to radar. This leads to the conclusion that a secondary, newer circulation developed around a mile east of the rapidly dissipating Smithville circulation. “

I asked him about potential radar mispositioning/miscoorelation, and he responded:

“ This tornado occurred extremely close to the radar, scans were only a few hundred feet above radar level. Also, the potential errors with couplet locations was something I did think about when trying to prove the cycle. I plotted the center of the reflectivity/velocity couplets/debris balls and matched its location with ground observed damage centerlines. At all points the radar data correlated perfectly with observed ground damage. ”

The radar used was also in Amory, not Columbus, which had the storm only a few hundred feet up. As for the apparent “tornado-caused tree blowdown”, those trees are on a hill and trees can fall in ways not caused by tornadoes.
I know where the KGWX radar is, it's always referred to as 'Columbus AFB' or 'Columbus' regardless of the exact intricacies of its location. The Huntsville radar isn't actually near Huntsville either. Importantly, there's no evidence of a handoff. I'm not replicating someone else's analysis when it hasn't been properly presented
 
I know where the KGWX radar is, it's always referred to as 'Columbus AFB' or 'Columbus' regardless of the exact intricacies of its location. The Huntsville radar isn't actually near Huntsville either. Importantly, there's no evidence of a handoff. I'm not replicating someone else's analysis when it hasn't been properly presented
I think he explained it pretty well?
 
Do any images exist from the Selmer EF3 (the 2025 one, not the Bethel Springs EF3)? I'm writing a Wikipedia article but I can't find any decent images of the event.
 
CORDOVA
and that's nothing compared to the mess that is the Cordova tornado , there are points that almost seems to be 4+ gaps , sometimes 3 separate scars at the same spot , and even a video that shows 2 to 3 tornadoes on the ground the same time.
View attachment 46850

its harder to map out Cordova with the EF3 that happened that same morning.

I'd heard Brian Peters and Tim Coleman describe two tornadoes in progress as the storm approached Cordova during their live play-by-play for 33/40, but as far as I can tell no separate tornado was ever confirmed by survey in this area.

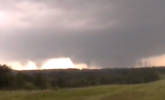
Just from this image, the tornadoes look too far apart and too similar in size to be a "main/satellite" pair, and it also doesn't look like an anticyclonic companion. Visually, it bears the strongest resemblance to a simple handoff/cycle, with the left tornado occluded and soon to dissipate (Peters/Coleman did report one of the tornadoes lifting not long after their observations began) and the right tornado recently formed and will intensify and continue through Cordova, Sumiton, Blountsville, etc.

If confirmed this would have split the track into separate EF3 and EF4 tornadoes; although per radar signatures the first tornado was extremely intense and likely violent during much of its track from just northeast of Reform to somewhere just south or southeast of Berry.

Speaking of, I think the Wikipedia article photo for this tornado must be captioned wrong; since, officially, it wasn't at EF4 intensity until past Cordova.
 
Back
Top