
I didn’t believe it until @A Guy produced a Fujita document proving it. He really did consider F6. Believe it or not, it wasn’t based on all the slabbed homes on the west side of town. The F6 consideration in Xenia was actually based on cycloidal scouring in farm fields as the tornado exited the east side of town. Cycloidal marking analysis has been used to come up with some pretty ridiculous wind speed estimates (Charles City, IA), and I haven’t seen it used in the modern era of tornado damage analysis. As a result, I question its validity.We don't even know *if* he actually did toy with the idea. It's as likely to be a silly rumor as the truth. Personally, I wonder what he saw in Xenia to initially call it F6.
I will say this though, I think had he seen a tornado damage like Jarrell or Bridge creek, maybe even El Reno '11 in the early 70's, F6 would have been a real thing.
Navigation
Install the app
How to install the app on iOS
Follow along with the video below to see how to install our site as a web app on your home screen.
Note: This feature may not be available in some browsers.
More options
-
Welcome to TalkWeather! We see you lurking around TalkWeather! Take the extra step and join us today to view attachments, see less ads and maybe even join the discussion. CLICK TO JOIN TALKWEATHER
You are using an out of date browser. It may not display this or other websites correctly.
You should upgrade or use an alternative browser.
You should upgrade or use an alternative browser.
Significant Tornado Events
- Thread starter locomusic01
- Start date
AJS
Member
528 mph winds for Charles City lol.I didn’t believe it until @A Guy produced a Fujita document proving it. He really did consider F6. Believe it or not, it wasn’t based on all the slabbed homes on the west side of town. The F6 consideration in Xenia was actually based on cycloidal scouring in farm fields as the tornado exited the east side of town. Cycloidal marking analysis has been used to come up with some pretty ridiculous wind speed estimates (Charles City, IA), and I haven’t seen it used in the modern era of tornado damage analysis. As a result, I question its validity.

Do you have a source on that being the reason for the F6 rating for Xenia? It's not in the Fujita paper that I showed had the rating, and I don't recall reading about him making an estimate from ground markings at Xenia elsewhere. He has papers that say 'probably 250-305 MPH' and one that implies up to 290 MPH. There's also the 265 MPH figure that was mentioned in one of those documentaries Grazulis made, but I'll be danged if I can keep track of the source. These were all from photogrammetry.I didn’t believe it until @A Guy produced a Fujita document proving it. He really did consider F6. Believe it or not, it wasn’t based on all the slabbed homes on the west side of town. The F6 consideration in Xenia was actually based on cycloidal scouring in farm fields as the tornado exited the east side of town. Cycloidal marking analysis has been used to come up with some pretty ridiculous wind speed estimates (Charles City, IA), and I haven’t seen it used in the modern era of tornado damage analysis. As a result, I question its validity.
I've explained the ground markings before but will again. The Charles City measurement, and I think other very high ones, was based off a method Edgar van Tassel published in 1955, who applied it one of the Scottsbluff tornadoes (and got 484 MPH). He assumed the markings were approximately closed ellipses (not cycloids) which seems to be the source of the very high speeds. I actually can't conceive how you'd get a closed, regular course.
Fujita in his Palm Sunday paper, made the sounder assumption that the marks are cycloidal (they obviously resemble cycloids in well-formed examples). As cycloids are open they accomodate more translation, so rotation (tangential velocity) can be slower. It relies the predictable variation of a cycloid's shape with the ratio of rotation to translation. He initially describes that this ratio can be gotten from the width of a loop, but then goes on to use loop spacing to determine the rotation time and to calculate windspeed based on that. It's not clear to me why the second step is necessary, except to obtain an average tangential velocity, as wind speed is finally produced by summing the tangential and translational velocities.
The one tornado in the paper he applied it to was L2, south of Swayzee. In this he uses multiple sets of marks to obtain rotational times at seven locations. Assuming the translational speed equalled the average speed of tornado family L, he got speeds of 172, 176, 173, 180, 180, 173 and 166 MPH. The Greentown tornado is known on here as one of the more intense ones from the outbreak, so low-end EF4 might surprise.
This assumes the mark is created from a point (which he assumed to be a suction vortex) that remains at constant angular velocity and central distance. In his real case he concludes the distance variation is probably not important (even though this means the markings aren't true cycloids). This is analogous to assumptions made in analyses of treefall patterns, and to single-POV photogrammetry (I once saw someone say that one reason photogrammetry declined in popularity was uncertainty over the actual shape of the trajectory. Now we have some videos with two or more angles filmed simultaneously it would be worth revisiting).
The method wasn't definitively disproven, but doesn't seem to have been very popular in published literature (it requires the tornado to have made marks, and getting rectified aerial photographs). A PhD thesis exploring markings only came up with a few citations, though I suspect there's more unpublished instances (e.g the measurement used to rate the 1990 Goessel tornado F5 wasn't formally published). Interest in direct measurements seems to have dried up, with photogrammetry disappearing by the mid 80s. I think the adoption of the Fujita scale was a factor, as it provided seemingly satisfactory estimates without the effort of, say, tracing film frames. Of course damage proxy measurements have turned out to be a minefield of assumptions and subjectivity.
The only people who've explored surface markings recently are David Lewellen and Michael Zimmerman, mainly in semi-formal literature like conference papers. Zimmerman's thesis found marks (cycloidal and otherwise) are created by irregularities in the corner flow region of the tornado depositing debris, with the type and strength of the marks depending on a few factors interacting in a complex manner. He and Lewellen seem more interested in what the qualitative nature of the marks says about the vortex properties. But Zimmerman does attempt a couple of image classification techniques, finding the marks too variable to get good results with his methods. So it appears not possible to do fairly objectively at the moment (Fujita effectively eyeballed his paths, having to assume they were fairly regular and continuous).
Practically no work of significance has been done since, and many other explorations of direct measurements are in the same boat. There just doesn't seem to be the interest to work these things out from basics to field. Unfortunately without fresh sets of eyes exploring each possible method the same issue is going to keep coming up where EF scale measurements are clearly problematic but there's nothing else.
Last edited:
Liberty4dayz
Member
I have a question for anyone who knows? Have we ever had an EF5 on a day where no risk was issued? I mean a completely out of nowhere type of tornado.
TH2002
Member
- Messages
- 4,973
- Reaction score
- 11,113
- Location
- California, United States
- Special Affiliations
- SKYWARN® Volunteer
I assume you want an answer that ignores events which predate SPC outlooks and weather watches and warnings?I have a question for anyone who knows? Have we ever had an EF5 on a day where no risk was issued? I mean a completely out of nowhere type of tornado.
The only ones I can (sort of) think of are Plainfield 1990 (which happened in a moderate risk area but came out of a Severe Thunderstorm Watch) and Chapman 2016 (which came out of a slight risk area with 5% tornado probs).
CheeselandSkies
Member
I have a question for anyone who knows? Have we ever had an EF5 on a day where no risk was issued? I mean a completely out of nowhere type of tornado.
EF5, no...but there have been a few relatively significant "surprise" tornado outbreaks.
April 20, 2004 saw most of central and northern Illinois and Indiana in a 5% wind and hail risk if anything (the "marginal" risk categorical contour did not exist then). It ended up producing 31 tornadoes across the region including an F3 which killed 8 people.
August 24, 2016 saw a similarly unexpected tornado outbreak hammer portions of eastern Indiana and adjacent northwest Ohio, including two rated EF3, one of which struck Kokomo, IN directly.
BennyILWX
Member
Wow, VIOLENT damage, incredible. Yeah Stratton definitely had some of the craziest non-F5 damage I've ever seen.
AJS
Member
Well, tomorrow will be the two year anniversary of the Rolling Fork, Mississippi Tornado and the other destructive March 24, 2023 tornadoes. Cannot believe it has already been two years. Still remember watching Ryan Hall live and seeing the tornado plow it’s way through town knowing something bad was going to happen.
The Winona tornado was close to another catastrophe due to the fact that it was so obvious another violent tornado was on the ground and aiming for a bigger populated area. And the Amory/Wren EF3 left me speechless with the way it looked on radar. I had never seen such an intense and large signature on radar like I did with the Amory tornado.
Here are some pictures that truly capture the nightmare these people experienced that day.
tornadotrx
Member
Not officially rated EF5, but the 2023 Matador, TX tornado was originally in a no risk area, it was upgraded to a 5% tornado risk I believe AFTER the tornado occurred. Damage from Matador is up there with some of the most violent Texas tornadoes on record, and it killed multiple people, so I think it fits the bill.I have a question for anyone who knows? Have we ever had an EF5 on a day where no risk was issued? I mean a completely out of nowhere type of tornado.
jiharris0220
Member
I’m beating a dead horse here but I’ll say it again anyways.Not officially rated EF5, but the 2023 Matador, TX tornado was originally in a no risk area, it was upgraded to a 5% tornado risk I believe AFTER the tornado occurred. Damage from Matador is up there with some of the most violent Texas tornadoes on record, and it killed multiple people, so I think it fits the bill.
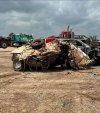
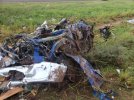
Matador imho, was THE most violent tornado, comparable to 1999 bridge creek and Jarrel. This tornado produced upper echelon ef5 damage that only few achieved.
1: caused vehicles to go missing while utterly dismantling many others into metal/steel scraps
2: completely debarked trees, but not just any trees, mesquite trees come up as one of the hardiest trees in the world. In all Janka, MOE, MOC, and MOR indexes.
Debarking a hard wood pine is one thing, managing to 100% debark a mesquite tree is a whole other level of violence that only tornadoes like Jarrel and Westminster matched.
(I’m sure tornadoes like Smithville and Bridge Creek would also manage to do the same had they also occurred in the same geographical region)
Most impressively, in some cases, not only did Matador manage to completely debarked mesquites, but obliterate them entirely. As in, some of these trees along with the two known vehicles, have gone missing after the tornado.

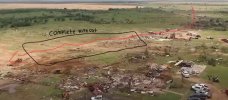
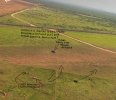
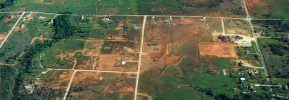
3: Finally, the DI that’s a signature hallmark of violent tornadoes is ground scouring. Most violent tornadoes, including most Ef5/F5s, produce patchy scorching.
Matador however, produced the extremely rare and dreaded wide continuous plowing of grass that leaves a solid deep line of dirt behind; something that only occurs in high end Ef5/F5s.
The true violence of this tornado has largely been forgotten/overlooked by most of the internet, and while I actually agree on its ef3 rating based solely off of conventional DIs, in terms of contextuals, Matador is by far the most violent tornado in recent times until Smithville 2011.


Attachments

Last edited:
AJS
Member
Ok, I always knew Matador was a no brainer EF4-EF5 based on contextuals, but this damage is easily some of the most extreme contextual damage i’ve seen from a tornado in the 2020s so far. Bremen comes close, but the sheer violence of Matador is something I didn’t even comprehend.I’m beating a dead horse here but I’ll say it again anyways.
Matador imho, was THE most violent tornado, comparable to 1999 bridge creek and Jarrel. This tornado produced upper echelon ef5 damage that only few achieved.
1: caused vehicles to go missing while utterly dismantling many others into metal/steel scraps
2: completely debarked trees, but not just any trees, mesquite trees come up as one of the hardiest trees in the world. In all Janka, MOE, MOC, and MOR indexes.
Debarking a hard wood pine is one thing, managing to 100% debark a mesquite tree is a whole other level of violence that only tornadoes like Jarrel and Westminster matched.
(I’m sure tornadoes like Smithville and Bridge Creek would also manage to do the same had they also occurred in the same geographical region)
Most impressively, in some cases, not only did Matador manage to completely debarked mesquites, but obliterate them entirely. As in, some of these trees along with the two known vehicles, have gone missing after the tornado.
View attachment 37096
3: Finally, the DI that’s a signature hallmark of violent tornadoes is ground scouring. Most violent tornadoes, including most Ef5/F5s, produce patchy scorching.
Matador however, produced the extremely rare and dreaded wide continuous plowing of grass that leaves a solid deep line of dirt behind; something that only occurs in high end Ef5/F5s.
The true violence of this tornado has largely been forgotten/overlooked by most of the internet, and while I actually agree on its ef3 rating based solely off of conventional DIs, in terms of contextuals, Matador is by far the most violent tornado in recent times until Smithville 2011.
View attachment 37107View attachment 37108
jiharris0220
Member
Bremen isn’t even remotely close, the ground scouring isn’t on the same level, debarking sure as hell doesn’t compare, the vehicle damage isn’t on the same level.Ok, I always knew Matador was a no brainer EF4-EF5 based on contextuals, but this damage is easily some of the most extreme contextual damage i’ve seen from a tornado in the 2020s so far. Bremen comes close, but the sheer violence of Matador is something I didn’t even comprehend.
Matador is in a completely different class entirely from Bremen.
AJS
Member
The ground scouring from Bremen was pretty remarkable though. But still, Matador eclipses it entirely.Bremen isn’t even remotely close, the ground scouring isn’t on the same level, debarking sure as hell doesn’t compare, the vehicle damage isn’t on the same level.
Matador is in a completely different class entirely from Bremen.
AJS
Member
Honestly, in my opinion even though it was rated EF3, you could argue that Matador so far could be in contention for the most violent tornado of the 2020s in terms of the damage it caused.
jiharris0220
Member
Bremen would be a good example of “classic” low end ef5 damage, comparable to Joplin, Greensburg, Rainsville, etc.The ground scouring from Bremen was pretty remarkable though. But still, Matador eclipses it entirely.
Matador represents the upper echelon of what a tornado can do, comparable to Smithville, Bridge Creek, Jarrel, etc.
Extreme, straight up there with some of the most violent. Not sure about bridge creek level, but easily EF5 intensity. The scouring is particularly extreme.I’m beating a dead horse here but I’ll say it again anyways.
Matador imho, was THE most violent tornado, comparable to 1999 bridge creek and Jarrel. This tornado produced upper echelon ef5 damage that only few achieved.
1: caused vehicles to go missing while utterly dismantling many others into metal/steel scraps
2: completely debarked trees, but not just any trees, mesquite trees come up as one of the hardiest trees in the world. In all Janka, MOE, MOC, and MOR indexes.
Debarking a hard wood pine is one thing, managing to 100% debark a mesquite tree is a whole other level of violence that only tornadoes like Jarrel and Westminster matched.
(I’m sure tornadoes like Smithville and Bridge Creek would also manage to do the same had they also occurred in the same geographical region)
Most impressively, in some cases, not only did Matador manage to completely debarked mesquites, but obliterate them entirely. As in, some of these trees along with the two known vehicles, have gone missing after the tornado.
View attachment 37096
3: Finally, the DI that’s a signature hallmark of violent tornadoes is ground scouring. Most violent tornadoes, including most Ef5/F5s, produce patchy scorching.
Matador however, produced the extremely rare and dreaded wide continuous plowing of grass that leaves a solid deep line of dirt behind; something that only occurs in high end Ef5/F5s.
The true violence of this tornado has largely been forgotten/overlooked by most of the internet, and while I actually agree on its ef3 rating based solely off of conventional DIs, in terms of contextuals, Matador is by far the most violent tornado in recent times until Smithville 2011.
View attachment 37107View attachment 37108
View attachment 37109
jiharris0220
Member
I say it’s Bridge Creek level because as far as I’ve seen, the level of violence (contextually) Bridge Creek doesn’t look any worse than what Matador produced.Extreme, straight up there with some of the most violent. Not sure about bridge creek level, but easily EF5 intensity. The scouring is particularly extreme.
Not really sure how you can get any worse than 100% debarked trees, vehicles going missing and mangled beyond recognition, and continuous deep ground scouring.
Both of these tornadoes achieved these feats.
The intensity of the damage I think. Bridge Creek just had unreal scouring. Like Matador was crazy violent, not sure about it being on Jarrell or Bridge Creek level though.I say it’s Bridge Creek level because as far as I’ve seen, the level of violence (contextually) Bridge Creek doesn’t look any worse than what Matador produced.
Not really sure how you can get any worse than 100% debarked trees, vehicles going missing and mangled beyond recognition, and continuous deep ground scouring.
Both of these tornadoes achieved these feats.
Attachments
TH2002
Member
- Messages
- 4,973
- Reaction score
- 11,113
- Location
- California, United States
- Special Affiliations
- SKYWARN® Volunteer
My thoughts on Matador in a nutshell:
I remember someone on twitter saying something along the lines of "the rating isn't at the fault of the surveyors" after the event, and well... I honestly have to say I agree to a very limited extent. The fact that it couldn't be rated EF5 literally isn't - if Bassfield didn't get rated EF5, Matador wouldn't have either.
However, the fact they didn't rate it EF4 absolutely is at the fault of the surveyors, particularly TTU who had a huge hand in the survey. Then again, I've learned to expect nothing more from people whose background is 100% engineering and 0% meteorology...
After seeing all the damage from Matador I'm 100% confident in saying it was well into the EF5 category in terms of intensity, even if it didn't hit any structures well built enough for an EF5 rating. The one house on the north side of town though - why didn't it get rated EF4? It had at least some anchoring and virtually disappeared with basically no debris remaining, not to mention the vehicles on the property were recovered in pieces hundreds of yards away. If that one house had a solid poured concrete foundation with proper anchoring all the way around, an EF5 rating would have been absolutely necessary imo.
Speaking of incompetence from NWS Lubbock, this tornado touched down near Hamlin on June 17, 2023 and caused "no known damage"
Also I think this is something interesting to compare, though its an older tornado.Alright I have just gotten back from talking with Hamilton County Historical Society on Tri-State and boy, there are loads of high quality images, I will put some in the article but what stood out to me was the hundreds of young persimmon hardwood trees that were entirely stripped of their bark...in an entirely rural area. Just incredible, perhaps the worst instance of debarking I have seen. Photo credit to McCoy Memorial Library and Hamilton County Historical Society.
View attachment 31532