
- Thread starter
- #441
Latest update, about an hour ago, with some emphasis added:
Updated May 31 at: 3:30 p.m
- The activity of the eruption quite stable last solar cycle
- Lava flows mainly between Hagafell and Sýlingarfell
- The average lava flow during the first four hours of the eruption was estimated at 1500 m3/s
- Gosmóda was seen in many parts of the country. You can monitor air quality here
- Gas pollution could be noticed in Ölfus and in the capital area in the coming days. Follow the gas distribution forecast here
- See updated risk assessment here
- The natural hazard expert's comments will be updated as needed over the weekend
The activity of the eruption, which started around noon on May 29, has been fairly constant for the last solar cycle. Activity on the fissure is from the crater that erupted furthest from the last eruption, towards Sundhnúk and on the fissure north of it. Lava flows mainly from the crater towards the area between Hagafell and Sýlingarfell and also thickens near it. Lava from the northern part of the fissure flows most to the east. There has been no advance on the lava fields that crossed Grindavíkurveg towards Þorbjörn and west of the town. The lava around the old crater piles up in close proximity to the active crater.
There is little to no seismic activity in the area and the unrest has remained constant since the previous day. A considerable amount of deformation was measured in Svartsengi following the magma flow on Wednesday, but since then no significant changes have been detected that indicate that magma accumulation has started there again. Measurements over the next few days will provide more information on the development of magma accumulation under Svartsengi and the progress of the eruption.
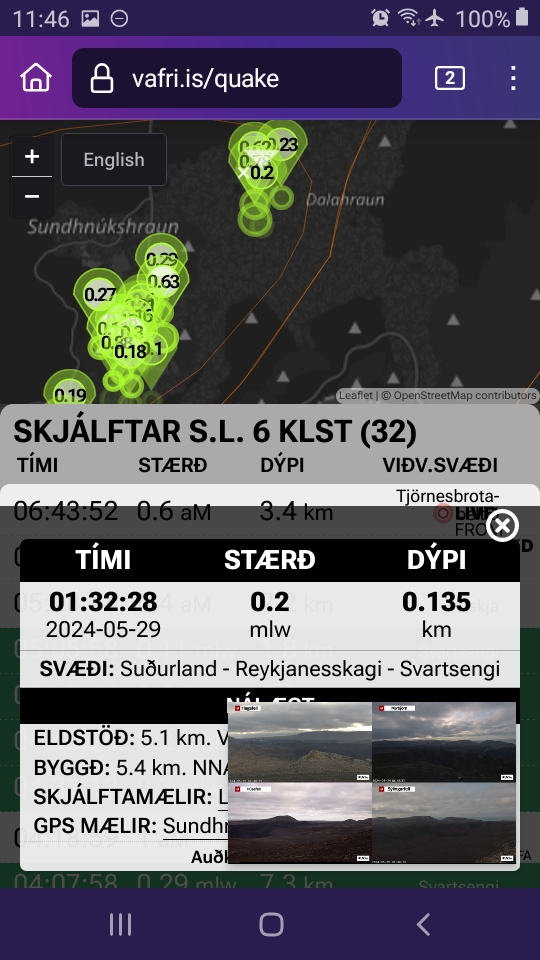
The imaging team of the National Institute of Natural Sciences and Land Survey of Iceland has processed data from a measurement flight that took place about four hours after the eruption began, together with satellite images. Based on that data, it can be seen that the area of the lava on the afternoon of May 29 had already reached 8.7 km2 and its volume 24 million m3. The average lava flow during the first four hours of the eruption is estimated to be ~1500 m3/s based on the same data. Estimates of the flow of lava emerging from the craters have not been updated since then, but it can be assumed that now it is many times less than at the beginning of the eruption. For comparison, the average lava flow during the first hours of the eruption that began on March 16 was estimated at 1100-1200 m3/s. More about it on the website of the Earth Sciences Institute .
Gosmóda was noticed in many parts of the country
Southwesterly until Sunday, when the wind turns to the west. A little wet in many places, especially in the southwestern part of the country. Gas pollution therefore travels to the northeast and later east and could be felt in Ölfus and in the capital area in the coming days. Gosmóða has been observed in many parts of the country during the last solstice cycle and has been measured by the Environment Agency. Soda is composed of very fine sulfur particles (SO 4 ) that have been created as a result of the chemical reaction of the soda mix with the moisture and oxygen of the atmosphere with the help of sunlight. When the day is long, as it is now, there is an increased chance of soda ash forming. Soda haze is not measured on SO 2 gas meters, but is visible as a gray-blue haze when a certain concentration is reached. An increase in fine particulate matter (PM 1 and PM2.5 ) can be an indication that SO 4 is present. You can monitor the air quality on the environmental institute's air quality meters.
Next week there is a chance of north and north-westerly directions and therefore a small chance of gas and air pollution in built-up areas.
Attached satellite image (Sentinel-5p) taken at 1:47 p.m. yesterday, May 30, shows the SO 2 plume that traveled from the eruption to the east and was observed, among other things, in the Austfjörður.
Updated hazard assessment
The National Weather Service has updated the risk assessment in light of the evolution of the eruption. Zones 1, 5 and 7 go from high risk to considerable risk (orange). The main change is that the risk of gas pollution, pyroclastic falls and lava flows is now considered lower than before in those areas. There is still a very high risk in area 3 (purple), which is the Sundhnúks crater series and the source of the eruption. The overall risk in area 4 (Grindavík) remains unchanged and is still assessed as high (red), but the risk of eruption, lava flow and pyroclastic fall is estimated to be lower than before. The card remains valid until June 4.
(Click on the map to see it larger)


")


