• Welcome to TalkWeather!
    We see you lurking around TalkWeather! Take the extra step and join us today to view attachments, see less ads and maybe even join the discussion.
    CLICK TO JOIN TALKWEATHER

2025 Global Tropical Cyclone Season Discussion

Fun fact: IMO it is the strongest candidate for "ATL storm that maybe shouldn't have been retired" since either Nate or Otto.
Other candidates of note:

Klaus 1990
Hortense 1996
Lenny 1999
Keith 2000
Iris 2001
Every single retirement in 2002 and 2003 in both the ATL and EPac
Alma 2008
Paloma 2008
Igor 2010
Ingrid 2013
Joaquin 2015
Patricia 2015
And, finally, every single CPac retirement except for Iniki
 
Last edited:
JMA has upgraded TD “a” to Tropical Storm Wipha, while the JTWC is maintaining it as 96W for now with a high chance of development into a tropical cyclone. The JTWC has noted that 96W/Wipha is maintaining characteristics of a monsoon depression with a wind radius of greater than 111 km as of now.
 
Metro-France has upgraded Zone of Disturbed Weather 01-20252026 to Tropical Depression 01 and they expect it to become a Moderate Tropical Storm early tomorrow. The JTWC maintains it at 35 kts as of currently.
 
The JTWC upgraded 96W to 09W, so we now have Tropical Storm Wipha truly from both JMA and the unofficial JTWC. Currently its intensity is 35 kts with a minimum pressure of 991 mb.

Meteo-France issued their last warning on 01/JTWC 01S, and the JTWC is still tracking and warning on it as of this time.
 
Don’t want to hype, but the way people were talking in the tropics community in 2017 vs now is ominously similar to now.
IMG_5409.png
IMG_5404.png
On this day 8 years ago the Eastern Pacific was at the letter “G”, while the ATL had just gotten the letter “D” from a mid-July tropical wave that became a TC.

The models right now are trying to tick up on a late-July MDR signal, which is a little later than 2017 but very similar too.

And just like early ENSO forecasts in 2017, this year had a warm ENSO bias that trended towards cooler ENSO later on in the year.

2017 and this year both have had sloppy TCs to start the season off too.


I’m mainly worried that we could see another 2017 at some point, but I really hope that a 2017-like season never happens again.

This was just something I noticed and wanted to share my thoughts on.

As in any season, having an evacuation plan is something that is very important. And if you are staying at home during a hurricane, having the necessary equipment and supplies is essential for you. Please stay safe during the rest of the season.
 
Last edited:
Don’t want to hype, but the way people were talking in the tropics community in 2017 vs now is ominously similar to now.
View attachment 45219
View attachment 45220
On this day 8 years ago the Eastern Pacific was at the letter “G”, while the ATL had just gotten the letter “D” from a mid-July tropical wave that became a TC.

The models right now are trying to tick up on a late-July MDR, which is a little later than 2016 but very similar too.

And just like early ENSO forecasts in 2017, this year had a warm ENSO bias that trended towards cooler ENSO later on in the year.

2017 and this year both have had sloppy TCs to start the season off too.


I’m mainly worried that we could see another 2017 at some point, but I really hope that a 2017-like season never happens again.

This was just something I noticed and wanted to share my thoughts on.

As in any season, having an evacuation plan is something that is very important. And if you are staying at home during a hurricane, having the necessary equipment and supplies is essential for you. Please stay safe during the rest of the season.
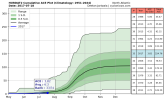
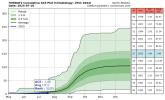
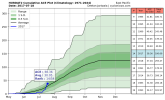
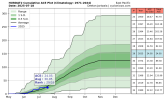
ACE in real time 2017 vs 2025

Atlantic (2017)
IMG_5435.png

Atlantic (2025)
IMG_5436.png
Notice that they are similar, now let’s look at the Eastern Pacific.

Eastern Pacific (2017)
IMG_5437.png

Eastern Pacific (2025)
IMG_5438.png


The ACE for the time of year this year vs 2017 for both basins are less than 2017’s ACE for both basins, but they are very similar still.

And we haven’t had a 200 or more ACE season in the Atlantic in 2020s yet, and the last 200 or more ACE season in the Atlantic was…. You guessed it, 2017.
 
Last edited:
I found an LRC connection between 2016 and 2017;

2016 (Matthew and a non-developed disturbance)
IMG_5480.jpeg

2017 (Irma and Jose)
IMG_5485.jpeg
Matthew was a part of the pattern that would later produce Irma.

And the 10% area of interest highlighted in the 2016 graphic would be the part of the pattern that would produce Jose.
 
I found an LRC connection between 2016 and 2017;

2016 (Matthew and a non-developed disturbance)
View attachment 45225

2017 (Irma and Jose)
View attachment 45226
Matthew was a part of the pattern that would later produce Irma.

And the 10% area of interest highlighted in the 2016 graphic would be the part of the pattern that would produce Jose.
In the end, I could see Matthew being the part of the pattern that would be responsible for Harvey and Irma, because Matthew’s early track was later similar to Harvey’s early track. But like I shared above, it later was at roughly the same location where Irma would be later in 2017.
 
Last edited:
In the end, I could see Matthew being the part of the pattern that would be responsible for Harvey and Irma, because Matthew’s ears track was later similar to Harvey’s early track. But like I shared above, it later was at roughly the same location where Irma would be later in 2017.
And also while Matthew was developing, you had this:

IMG_5487.jpeg

The yellow lemon in the Gulf could be the part of the pattern that led to Hurricane Katia in 2017.

Katia on the 2017 map for reference;
IMG_5488.jpeg
 
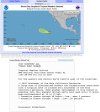
New lemon marked in the Eastern Pacific, 0/20:
IMG_5492.jpeg
This could have a chance to develop before crossing 140*W into the Central Pacific basin.
 
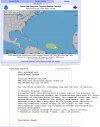
Tropical Wave apparently interacting with an area low pressure in the MDR has been marked by the NHC, first disturbance in the MDR this season too:
IMG_5704.jpeg
 
Tropical Wave apparently interacting with an area low pressure in the MDR has been marked by the NHC, first disturbance in the MDR this season too:
View attachment 45231
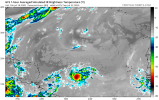
GFS spins it up into a brief TC on the 18Z run, and here is a simulated satellite view;


IMG_5707.png
 
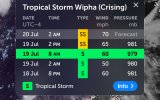
This is particularly interesting: earlier today Wipha had maximum sustained winds of 50 kts (60 mph). Sounds normal, right? It gets weirder, at the same time that Wipha had max winds of 50 kts (60 mph) Wipha had a pressure of 979 MBS!

A mid-end tropical storm with a pressure of a mid-end Category 1 nearing Category 2 pressures!
IMG_6509.jpeg
This is partly due to Wipha’s monsoonal origins.
 
This is particularly interesting: earlier today Wipha had maximum sustained winds of 50 kts (60 mph). Sounds normal, right? It gets weirder, at the same time that Wipha had max winds of 50 kts (60 mph) Wipha had a pressure of 979 MBS!

A mid-end tropical storm with a pressure of a mid-end Category 1 nearing Category 2 pressures!
View attachment 45305
This is partly due to Wipha’s monsoonal origins.
A nearby buoy in proximity to Wipha has recorded a pressure of 968 mbs. That’s an absurd pressure for a tropical storm. This sucker has Category 2 pressures despite being only a tropical storm.
 
A nearby buoy in proximity to Wipha has recorded a pressure of 968 mbs. That’s an absurd pressure for a tropical storm. This sucker has Category 2 pressures despite being only a tropical storm.

IMG_6619.jpeg
Just look at this insanity!
 
JTWC went with 60 kts/ 970 mb for the 00Z best track point

09W WIPHA 250720 0000 21.6N 114.6E WPAC 60 970
This was updated to 65kts, and Wipha is now the third typhoon of the season in the Western Pacific.

09W WIPHA 250720 0000 21.6N 114.6E WPAC 65 970
 
This was updated to 65kts, and Wipha is now the third typhoon of the season in the Western Pacific.

09W WIPHA 250720 0000 21.6N 114.6E WPAC 65 970
Wipha was a typhoon for just 12 hours, and it is now slightly inland skirting the coast of Southeastern China after passing close to Hong Kong. Wipha has the potential to reintensify over the 30-31*C waters of the Gulf of Tonkin in about 12-24 hours.

The other monsoon signal has been given an invest designation as Invest 97W;
ABPW10 PGTW 201200
MSGID/GENADMIN/JOINT TYPHOON WRNCEN PEARL HARBOR HI//
SUBJ/SIGNIFICANT TROPICAL WEATHER ADVISORY FOR THE WESTERN AND SOUTH
PACIFIC OCEANS REISSUED/201200Z-210600ZJUL2025//
REF/A/MSG/JOINT TYPHOON WRNCEN PEARL HARBOR HI/200751ZJUL2025//
AMPN/REF A IS A TROPICAL CYCLONE WARNING.//
RMKS/
1. WESTERN NORTH PACIFIC AREA (180 TO MALAY PENINSULA):
A. TROPICAL CYCLONE SUMMARY:
(1) AT 20JUL25 0600Z, TYPHOON 09W (WIPHA) WAS LOCATED NEAR 21.9N
113.2E, APPROXIMATELY 61 NM WEST- SOUTHWEST OF HONG KONG, AND HAD
TRACKED WESTWARD AT 13 KNOTS OVER THE PAST SIX HOURS. MAXIMUM SUSTAINED
SURFACE WINDS WERE ESTIMATED AT 65 KNOTS GUSTING TO 80 KNOTS. SEE REF A
(WTPN31 PGTW 200900) FOR FURTHER DETAILS.
(2) NO OTHER TROPICAL CYCLONES.
B. TROPICAL DISTURBANCE SUMMARY:
(1) AN AREA OF CONVECTION (INVEST 97W) HAS PERSISTED NEAR 12.5N
135.0E, APPROXIMATELY 257 NM NORTHWEST OF YAP. ANIMATED ENHANCED
INFRARED SATELLITE IMAGERY (EIR) DEPICTS A SMALL AND POORLY ORGANIZED
LOW LEVEL CIRCULATION CENTER (LLCC) OBSCURED BY FLARING CONVECTION THAT
IS SHEARED FROM THE WEST AS EVIDENT IN A 200902Z SSMIS PASS.
ENVIRONMENTAL ANALYSIS FOR THE AREA INDICATES MARGINALLY FAVORABLE
CONDITIONS FOR DEVELOPMENT WITH HIGH (30-40 KTS) VERTICAL WIND SHEAR
OFFSET BY WARM (30 C) SEA SURFACE TEMPERATURES AND MODERATE EQUATORWARD
OUTFLOW ALOFT. GLOBAL DETERMINISTIC MODELS ARE IN FAIR AGREEMENT THAT
THE AREA OF CONVECTION 97W WILL CONTINUE NORTH AS IT GRADUALLY
INTENSIFIES OVER THE NEXT 48 HOURS. ENSEMBLE GUIDANCE AGREES ON A NORTH
TO NORTHWESTERN TRACK WITH ECENS BEING MORE AGGRESSIVE ON DEVELOPMENT
THAN THE GEFS. MAXIMUM SUSTAINED SURFACE WINDS ARE ESTIMATED AT 13 TO
18 KNOTS. MINIMUM SEA LEVEL PRESSURE IS ESTIMATED TO BE NEAR 1009 MB.
THE POTENTIAL FOR THE DEVELOPMENT OF A SIGNIFICANT TROPICAL CYCLONE

WITHIN THE NEXT 24 HOURS IS LOW.
 
Back
Top