- Thread starter
- #21
Havaheart66
Member
I been a member since 2005 it was on my bucket list I just had to start a weather thread. Please blame it on the bucketIf I get an ice storm, I know who to blame now!
Last edited:
Follow along with the video below to see how to install our site as a web app on your home screen.
Note: This feature may not be available in some browsers.
I been a member since 2005 it was on my bucket list I just had to start a weather thread. Please blame it on the bucketIf I get an ice storm, I know who to blame now!
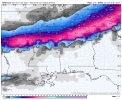
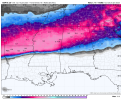
Maybe suppressed is the wrong term but the gfs seems to bring the system I. A day or two later.I wouldn't call this a suppressed 12z GFS snow total. In fact, all 12z operational runs today are showing a good snow storm except 12z Euro came in less with the totals.
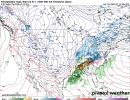
Usually big snow events in the south happen by way of pattern changers....big storms that result in a shift in the upper air flow. Gfs suggests that would be the late week one. I have a sneaky feeling that there will be arctic boundary nearby and until the pattern changer comes, there may be another risk of wintry weather as energy throws moisture over the boundary.Maybe suppressed is the wrong term but the gfs seems to bring the system I. A day or two later.

My son and I are thinking of escaping the coming winter blitzkrieg - especially if there's a high likelihood the power goes out - because I would like to be able to feel my hands (and possibly feet) those days. (Not joking, I have Raynaud's, among multiple other things.) What part of Alabama or Tennessee is the least likely (as of now) to be affected by winter precipitation, if there is any? Thank you.
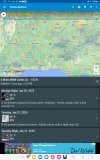
Yay! I'm near Selma...just hope it's snow and not freezing rain...I know a lot can change over the weekend.Experimental Graphical Hazardous Weather Outlook from BMX

Miami is always a good bet but watch out for falling iguanas. On a serious note, watch where the freezing line is on sunday or so and get below it (looking like Orlando or south for now). Anywhere north you go will still be in the deep freeze.My son and I are thinking of escaping the coming winter blitzkrieg - especially if there's a high likelihood the power goes out - because I would like to be able to feel my hands (and possibly feet) those days. (Not joking, I have Raynaud's, among multiple other things.) What part of Alabama or Tennessee is the least likely (as of now) to be affected by winter precipitation, if there is any? Thank you.
Miami is always a good bet but watch out for falling iguanas. On a serious note, watch where the freezing line is on sunday or so and get below it (looking like Orlando or south for now). Anywhere north you go will still be in the deep freeze.