- Thread starter
- #441
Navigation
Install the app
How to install the app on iOS
Follow along with the video below to see how to install our site as a web app on your home screen.
Note: This feature may not be available in some browsers.
More options
-
Welcome to TalkWeather! We see you lurking around TalkWeather! Take the extra step and join us today to view attachments, see less ads and maybe even join the discussion. CLICK TO JOIN TALKWEATHER
You are using an out of date browser. It may not display this or other websites correctly.
You should upgrade or use an alternative browser.
You should upgrade or use an alternative browser.
2025 Global Tropical Cyclone Season Discussion
- Thread starter Atlantic
- Start date
Kds86z
Member
It appears in the 2-day outlook as well;
View attachment 43562
Do you like this change,?
- Thread starter
- #443
I do indeed! I have been hoping they would do it for years. Apparently I looked back in the archives and it started at the 5am PST outlook this morning. Any outlooks before it had the old style map.Do you like this change,?
- Thread starter
- #444
Not necessarily related to this season, but it's a question involving global tropical cyclone intensity: What is the rationale behind giving Super Typhoon Haiyan an official 895 mbar pressure estimation when it was 1) easily the most impressive radar presentation you could ask for in a tropical cyclone, maybe outside of Patricia 2015 or Gay 1992, and 2) contained 1-min and 10-min sustained windspeeds rivaling super typhoons or hurricanes with pressure readings in or around the ~880 mbar range? I've seen a sentiment shared that Haiyan could have possibly gone as low as 858 mbar based on Dvorak presentation, but that to me seems way overkill. I'd be shocked if Haiyan didn't go sub-890 mbar at least, it was an absolute monster and it was located in the western pacific, which is known for having lower pressures than Atlantic hurricanes of similar wind intensity.
2024 went 142 days without the first tropical system. We've surpassed that at 152 consecutive days now this year.@JPWX the WPAC has gone into June without the first TC.
When was the last time we went this long without the first TC, and why has the WPAC been so silent?
Only 3 years since 1950 went longer:
1983: 174
1984: 158 (we should surpass 1984 easily)
1998: 187
Would put 2025 in 3rd place.
Reasons why the West Pacific has been so quiet to be quite honest I have no idea. There's a plethora of reasons (including ENSO status, MJO, pressure differences, etc.) A combination of all is probably the best answer. Wish I could be more definitive.
To answer your question, due to all western Pacific systems pressure's being derived from satellite data, it's a pure guess at pressure. It's unfortunate that recon quit flying into West Pacific storms after Super Typhoon Tip. There's so much valuable data we are missing from not flying into these typhoons and it's data we could use to add into the forecast models. Satellite data is good, but it only goes so far. Heck you could fly unmanned drones into them now. Haiyan and many other recent typhoons have come close to and/or surpassed Tip's pressure. Patricia is another one that could have outside of the West Pac.Not necessarily related to this season, but it's a question involving global tropical cyclone intensity: What is the rationale behind giving Super Typhoon Haiyan an official 895 mbar pressure estimation when it was 1) easily the most impressive radar presentation you could ask for in a tropical cyclone, maybe outside of Patricia 2015 or Gay 1992, and 2) contained 1-min and 10-min sustained windspeeds rivaling super typhoons or hurricanes with pressure readings in or around the ~880 mbar range? I've seen a sentiment shared that Haiyan could have possibly gone as low as 858 mbar based on Dvorak presentation, but that to me seems way overkill. I'd be shocked if Haiyan didn't go sub-890 mbar at least, it was an absolute monster and it was located in the western pacific, which is known for having lower pressures than Atlantic hurricanes of similar wind intensity.
Kds86z
Member
2024 went 142 days without the first tropical system. We've surpassed that at 152 consecutive days now this year.
Only 3 years since 1950 went longer:
1983: 174
1984: 158 (we should surpass 1984 easily)
1998: 187
Would put 2025 in 3rd place.
Reasons why the West Pacific has been so quiet to be quite honest I have no idea. There's a plethora of reasons (including ENSO status, MJO, pressure differences, etc.) A combination of all is probably the best answer. Wish I could be more definitive.
@Atlantic
- Thread starter
- #450
Third place. That hits hard for it being the WPAC. It almost makes me worry for the EPAC and the ATL.
I think the saying goes “where one basin fails, another one must pick the slack”
Correct.Third place. That hits hard for it being the WPAC. It almost makes me worry for the EPAC and the ATL.
I think the saying goes “where one basin fails, another one must pick the slack”
- Thread starter
- #452
On this day 2 years ago in the Atlantic this happened;
“A short-lived tropical storm is not something we'd normally reflect back on in history, but the first storm of the Atlantic season two years ago had an interesting quirk because of the direction it tracked in the Gulf.
Tropical Storm Arlene was named on June 2, 2023, in the eastern Gulf to the south and west of Florida. Normally when a tropical storm or hurricane is located in this region of the Gulf, it's almost a lock it will strike some part of the U.S. Gulf Coast. That's because storms in this area typically track in some sort of north, east or west direction, which all bring land into play.
But, Arlene had another plan and did the opposite by taking what the National Hurricane Center called an unusual north-to-south path over the eastern Gulf because of the upper-level steering currents that were in place. It then fizzled in the face of strong winds aloft while approaching Cuba just over 24 hours later.”
- Thread starter
- #453
- Thread starter
- #454
- Thread starter
- #455
GFS try not to forecast a strong storm that IF it even happens will likely be much weaker challenge: Impossible
GFS try not to forecast a weaker Irma Florida landfall and post-Florida landfall track challenge: Impossible


We know this likely won’t happen because no other model shows it. But as the MJO moves in, we could see a CAG event take shape that possibly could spin up a TC, but I’m not currently buying it.
GFS try not to forecast a weaker Irma Florida landfall and post-Florida landfall track challenge: Impossible


We know this likely won’t happen because no other model shows it. But as the MJO moves in, we could see a CAG event take shape that possibly could spin up a TC, but I’m not currently buying it.
- Thread starter
- #456
- Thread starter
- #457
- Thread starter
- #458
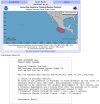
Tropical Wave #3 was first introduced in the Western Caribbean Sea on May 31st at 06Z. I think I was just about able to trace it back to Africa on May 22nd.The Eastern Pacific AOI has shown up at last, and is likely just Tropical Wave #3 (the third tropical wave to move off the coast of Africa and third wave to be introduced into the United Surface Analysis) it is at 10% in 2-days and 80% in 7-days:
View attachment 43662
View attachment 43663
Last edited:
- Thread starter
- #459
- Thread starter
- #460
A study on Atlantic Nino against ENSO:
Our analysis of observational and reanalysis datasets during 1948-2019, together with model experiments, shows that Atlantic Niño strengthens the Atlantic intertropical convergence zone, increasing rainfall over the west African sub-Sahel region and African easterly waves. Additionally, the enhanced atmospheric convection produces low-level westerly wind anomalies over the tropical North Atlantic, which in turn increase low-level relative vorticity and decrease vertical wind shear over the Atlantic TC main development region (MDR). These atmospheric conditions over the MDR are favorable for increasing Atlantic TC activity. Further analysis shows that the tendency for La Niña to enhance Atlantic TC activity is amplified during Atlantic Niña and weakened during Atlantic Niño. Conversely, unfavorable conditions for Atlantic TC activity during El Niño are amplified during Atlantic Niña, but suppressed during Atlantic Niño. This study suggests that Atlantic Niño/Niña may aid to improve the current seasonal prediction skill of Atlantic TC activity.
Our analysis of observational and reanalysis datasets during 1948-2019, together with model experiments, shows that Atlantic Niño strengthens the Atlantic intertropical convergence zone, increasing rainfall over the west African sub-Sahel region and African easterly waves. Additionally, the enhanced atmospheric convection produces low-level westerly wind anomalies over the tropical North Atlantic, which in turn increase low-level relative vorticity and decrease vertical wind shear over the Atlantic TC main development region (MDR). These atmospheric conditions over the MDR are favorable for increasing Atlantic TC activity. Further analysis shows that the tendency for La Niña to enhance Atlantic TC activity is amplified during Atlantic Niña and weakened during Atlantic Niño. Conversely, unfavorable conditions for Atlantic TC activity during El Niño are amplified during Atlantic Niña, but suppressed during Atlantic Niño. This study suggests that Atlantic Niño/Niña may aid to improve the current seasonal prediction skill of Atlantic TC activity.


