Lake Martin EF4
Member
The WMO committee announces retirements tomorrow.
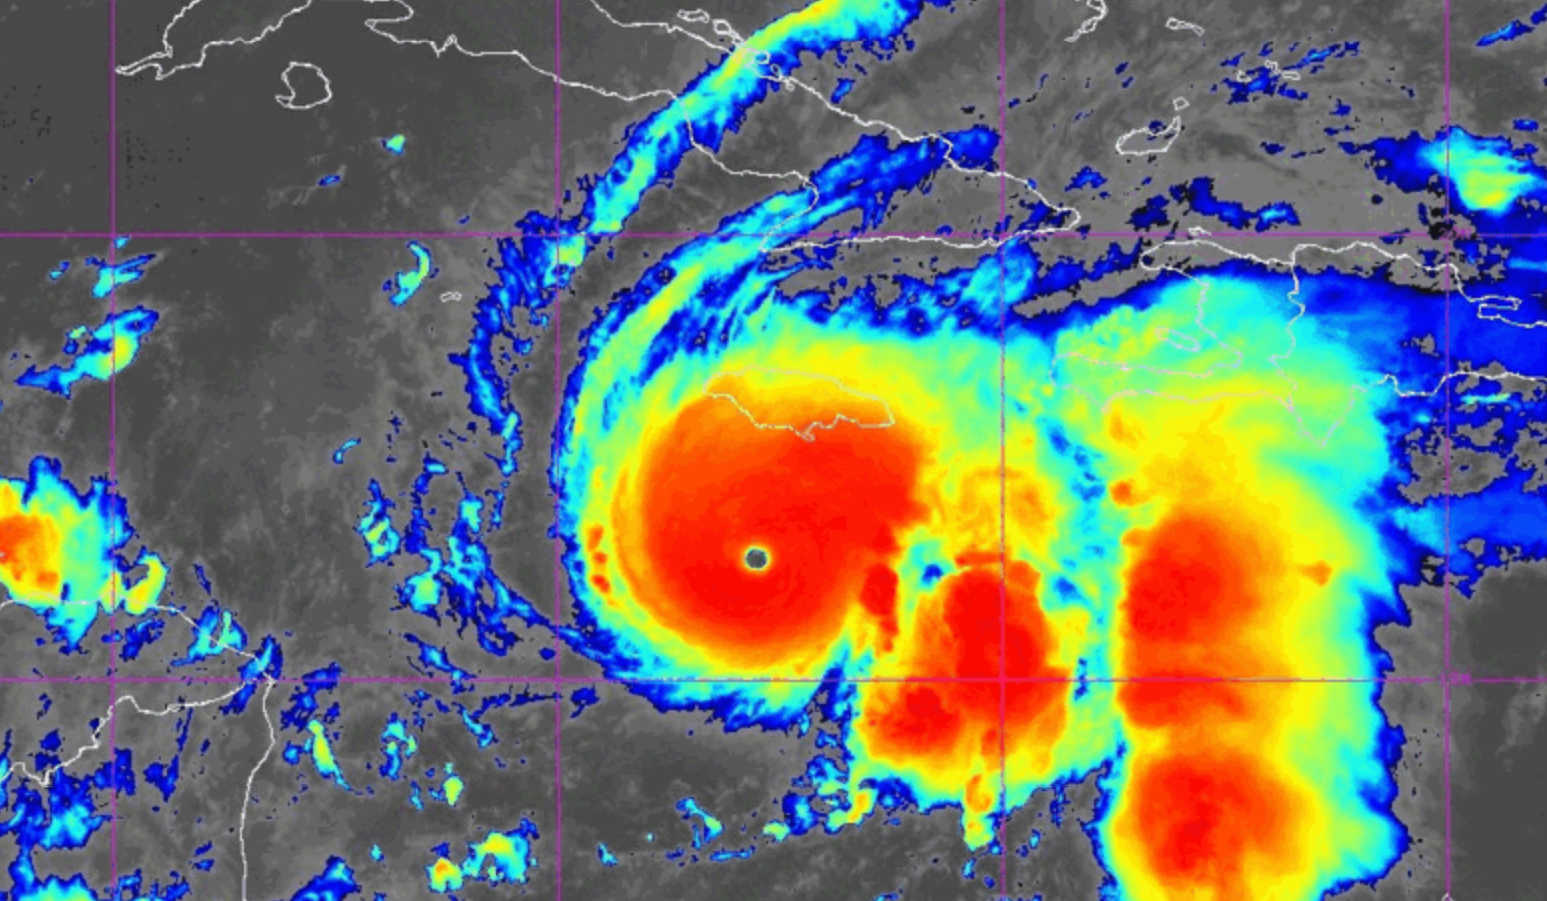
FINAL PREDICTION: Melissa is the only name retired in either basin. I saw on Storm2k a rumor that the first country to request a name's retirement picks its replacement - since Cuba was the first to request Melissa's retirement, if that rumor is true then expect a Hispanic name to replace it. UPDATE: Maybe Imelda goes too
FINAL PREDICTION: Melissa is the only name retired in either basin. I saw on Storm2k a rumor that the first country to request a name's retirement picks its replacement - since Cuba was the first to request Melissa's retirement, if that rumor is true then expect a Hispanic name to replace it. UPDATE: Maybe Imelda goes too
Last edited: