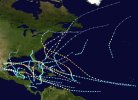
I have been able to put every Atlantic Hurricane Season number of ACE together in order from greatest to least amount of ACE. Bear with me here;
The first 8 seasons are what I call the elite 200.
————————————————————
100 out of the 173 seasons listed, will finish the rest tomorrow.
The first 8 seasons are what I call the elite 200.
————————————————————
100 out of the 173 seasons listed, will finish the rest tomorrow.
1st place: 1933 (258.57)
2nd place: 2005 (250.13)
3rd place: 1893 (231.15)
4th place: 1926 (229.56)
5th place: 1995 (227.10)
6th place: 2004 (226.88)
7th place: 2017 (224.87)
8th place: 1950 (211.28)
9th place: 1961 (188.89)
10th place: 1998 (181.77)
11th place: 1887 (181.26)
12th place: 1878 (180.85)
13th place: 2020 (180.37)
14th place: 2003 (176.84)
15th place: 1999 (176.53)
16th place: 1932 (169.66)
17th place: 1996 (166.18)
18th place: 1886 (166.17)
19th place: 2010 (165.48)
20th place: 1906 (162.88)
21st place: 2024 (161.10)
22nd place: 1955 (158.17)
23rd place: 1964 (153.04)
24th place: 1899 (151.03)
25th place: 1969 (149.25)
26th place: 1980 (148.94)
27th place: 2008 (145.72)
28th place: 2023 (145.6)
29th place: 2021 (145.55)
30th place: 1916 (144.01)
31st place: 2016 (141.25)
32nd place: 1966 (138.28)
33rd place: 1896 (136.08)
34th place: 1894 (135.42)
35th place: 1989 (135.13)
36th place: 2012 (132.20)
37th place: 2018 (132.58)
38th place: 2019 (132.20)
39th place: 1880 (131.08)
40th place: 1915 (130.10)
41st place: 1951 (126.33)
42nd place: 2011 (126.30)
43rd place: 1967 (125.43)
44th place: 2000 (119.14)
45th place: 1891 (116.11)
46th place: 1892 (115.84)
47th place: 1898 (113.24)
48th place: 1963 (112.09)
49th place: 1954 (110.88)
50th place: 2001 (110.32)
51st place: 1958 (109.69)
52nd place: 1935 (106.21)
53rd place: 1944 (104.45)
54th place: 1889 (104.04)
55th place: 1988 (102.99)
56th place: 1903 (102.07)
57th place: 1981 (100.38)
58th place: 1924 (100.19)
59th place: 1936 (99.78)
60th place: 1901 (98.98)
61st place: 1953 (98.51)
62nd place: 1990 (96.80)
63rd place: 1971 (96.53)
64th place: 1949 (96.45)
65th place: 1908 (95.11)
66th place: 2022 (95.10)
67th place: 1948 (94.98)
68th place: 1943 (94.01)
69th place: 1909 (93.34)
70th place: 1979 (92.92)
71st place: 1947 (88.49)
72nd place: 1871 (88.39)
73rd place: 1985 (87.98)
74th place: 1870 (87.80)
75th place: 1965 (86.74)
76th place: 1921 (86.53)
77th place: 1888 (84.95)
78th place: 1984 (84.30)
79th place: 1976 (84.17)
80th place: 1866 (83.65)
81st place: 1928 (83.48)
82nd place: 1900 (83.35)
83rd place: 1934 (79.07)
84th place: 1957 (78.66)
85th place: 2006 (78.54)
86th place: 1938 (77.58)
87th place: 1959 (77.11)
88th place: 1853 (76.49)
89th place: 1992 (76.22)
90th place: 1975 (76.06)
91st place: 2007 (73.89)
92nd place: 1877 (73.36)
93rd place: 1852 (73.28)
94th place: 1960 (72.90)
95th place: 1875 (72.48)
96th place: 1884 (72.06)
97th place: 1873 (69.47)
98th place: 1952 (69.08)
99th place: 1895 (68.77)
100th place: 1974 (68.13)


